Glossary
| Term | Definition |
|---|---|
| AOV (Average Order Value) | Average revenue generated per order. |
| Bounce Rate | Percentage of users who leave the site without any interaction. |
| Add-to-Cart Rate | Percentage of users who add at least one item to their cart. |
| Cart Abandonment Rate | Percentage of shoppers who add products to their cart but do not complete the purchase. |
| Checkout Abandonment Rate | Shoppers who initiate checkout but don’t finalize the purchase. |
| ROI (Return on Investment) | Profitability ratio of revenue generated vs. costs incurred. |
| SMART Goals | Specific, Measurable, Achievable, Relevant, Time-bound objectives. |
Introduction
You’ve invested time, effort, and budget into driving traffic to your eCommerce store—but what happens when visitors don’t convert? If your site traffic isn’t turning into real dollars, your website isn’t fulfilling its potential.

In this expanded guide, we’ll show you how to assess your website’s profitability step-by-step and apply actionable strategies to make every visitor count.
Step 1: Calculate Your Average Order Value (AOV)
Your AOV reveals how much customers spend, on average, per order. It’s one of the most critical profitability indicators.
How to Calculate AOV:
AOV = Total Revenue / Number of Orders
Platform Examples:
- Shopify: Reports > Finances > Sales
- WooCommerce: Analytics > Orders
- Magento: Reports > Sales > Orders
Pro Tips:
- Segment AOV by device, traffic source, or campaign to uncover high-value opportunities.
- Set a SMART goal like: “Increase AOV from $72 to $85 within 60 days through bundling.”
Step 2: Measure Monthly Traffic Volume
Traffic volume affects your sales ceiling. But not all traffic is equal—focus on quality traffic that converts.
How to Track It:
- Use Google Analytics 4 to track traffic by source, session, and new vs. returning users.
Benchmarks to Monitor:
| Source | Bounce Rate | Conversion Rate |
|---|---|---|
| Organic | < 50% | > 3% |
| Paid | < 60% | > 2.5% |
| < 40% | > 4.5% |
Step 3: Unpack Key Website Metrics
Now dig deeper. Traffic means nothing if users are abandoning carts or not engaging.
Critical Metrics:
| Metric | What It Tells You | Ideal Range |
|---|---|---|
| Bounce Rate | Immediate exits | < 45% |
| Add-to-Cart Rate | Purchase intent | > 4% |
| Cart Abandonment Rate | Friction in checkout | < 65% |
| Checkout Abandonment Rate | Checkout UX issues | < 40% |
Recommended Tools:
- Google Analytics (Enhanced eCommerce enabled)
- Hotjar (Session recordings + Heatmaps)
- Klaviyo or Omnisend (behavioral analytics + triggers)
Action Tip:
Set up dashboards to automatically track weekly and monthly performance. Monitor trends, not just static numbers.
Step 4: Analyze, Adjust, and Increase Profitability
With AOV and traffic data in hand, you can start modeling ROI.
Use This ROI Formula:
ROI = [(Revenue – Cost) ÷ Cost] x 100
Estimate Potential Gains:
If your AOV is $60, and you have 1,000 monthly carts with a 65% abandonment rate:
- Reducing abandonment to 60% = 50 more sales = $3,000 in revenue uplift/month.
Tables to Add:
- Monthly ROI Tracker: Columns for traffic, AOV, conversion rate, revenue, cart abandonments
- Revenue Impact Chart: X-axis (conversion lift %) vs. Y-axis (expected revenue)
What to Do Next: Optimize & Execute
1. Lower Bounce Rate
- Compress images for faster load times
- Add sticky headers with CTAs
- Display trust badges and social proof above the fold
2. Boost Product Discovery
- Add smart filters and AI-powered search
- Create category-specific landing pages
- Highlight best-sellers and trending items on homepage
3. Increase Add-to-Cart Rate
- Use scarcity language (“Only 3 left”)
- Show “Add to Cart” above the fold
- Offer one-click add-to-cart buttons on collection pages
4. Reduce Cart Abandonment
- Implement a 3-email abandoned cart flow
- Test exit-intent popups with time-sensitive offers
- Use SMS reminders as part of cart recovery
5. Streamline Checkout
- Allow guest checkout
- Minimize the number of fields
- Accept multiple payment methods (Shop Pay, Klarna, PayPal)
Frequently Asked Questions
1. What is a good eCommerce AOV?
It varies by industry, but generally $60–$100 is considered solid. Benchmark against your top traffic sources.
2. How can I quickly reduce my bounce rate?
Improve above-the-fold content, page speed, and include clear CTAs. Eliminate distractions and make navigation intuitive.
3. What’s a typical cart abandonment rate?
Anywhere from 60–80%. Aim to stay under 65%, with strategic email and SMS recovery flows in place.
4. How do I know if traffic quality is poor?
High bounce rates, low add-to-cart rates, and poor on-site engagement signal poor-quality traffic or mismatched messaging.
5. Is AOV more important than conversion rate?
Both matter. AOV boosts revenue per customer, while conversion rate increases volume. Optimize them together.
6. Should I track desktop and mobile separately?
Yes. Mobile often has lower conversion rates due to friction. Prioritize mobile CRO in 2025.
Final Thoughts
Your website’s profitability hinges on the small details: how fast it loads, how clearly it communicates value, and how frictionless it is for the user.
Start with this 4-step process:
- Know your numbers
- Track what matters
- Find the leaks
- Fix and repeat
Need help turning your traffic into sales? At Blossom Ecom, we help brands like yours unlock revenue by optimizing every step of the funnel—from product discovery to checkout.
Contact us for a free profitability audit today. Let’s make your site work harder—and convert better.
Related Reads Handpicked for You
- Best Practices for Optimizing Email Flows with Klaviyo
- The Ultimate Crash Course Email Marketing for E-commerce Store
- Best Practices for Optimizing Email Flows with Klaviyo
- How to Customize Shopify Email Templates Quickly and Efficiently
- The Next Frontier of E-Commerce: What’s Coming and How to Prepare
Need help implementing this?
Let us take the hassle of managing your email marketing channel off your hands. Book a strategy call with our team today and see how we can scale your revenue, customer retention, and lifetime value with tailored strategies. Click here to get started.
Curious about how your Klaviyo is performing?
We’ll audit your account for free. Discover hidden opportunities to boost your revenue, and find out what you’re doing right and what could be done better. Click here to claim your free Klaviyo audit.
Want to see how we’ve helped brands just like yours scale?
Check out our case studies and see the impact for yourself. Click here to explore.

Read Our Other Blogs

Abandoned Cart Flow Strategy: Why Your Recovery Sequence Stops Working After Email One


Ecommerce Email Benchmarks: What Good Actually Looks Like for DTC Brands in 2026

Retention-Focused A/B Testing: What to Test in Email When You've Already Optimized the Basics
Abandoned Cart Flow Strategy: Why Your Recovery Sequence Stops Working After Email One
Ecommerce Email Benchmarks: What Good Actually Looks Like for DTC Brands in 2026
Retention-Focused A/B Testing: What to Test in Email When You've Already Optimized the Basics

Klaviyo Segments vs Lists: How to Structure Your Audience Architecture for Scalable Retention

Email Deliverability for Ecommerce: The Complete Guide to Landing in the Inbox

Klaviyo List Hygiene: How to Clean Your Email List Without Killing Your Revenue

Sunset Flow: How to Win Back Unengaged Subscribers Before You Suppress Them

Welcome Flow Optimization: How to Turn New Subscribers Into First-Time Buyers Faster

Popup Strategy for Ecommerce: How to Grow Your List Without Training Customers to Wait for Discounts

Email Offer Architecture: How to Structure Promotions That Protect Margin and Still Convert

Klaviyo vs Attentive: Which Platform Is Right for Your DTC Stack in 2026

Migrating to Klaviyo: The Step-by-Step Playbook for Switching ESPs Without Losing Revenue

Browse Abandonment Flow: The Underbuilt Sequence Quietly Leaking Revenue

Post-Purchase SMS Flow: How to Use Text Messages to Build Loyalty After the First Order

Retention Marketing Dashboard: The Exact Metrics and Reports You Should Be Reviewing Weekly

Agency vs In-House Email Marketing: What Actually Moves the Needle for DTC Brands

SMS Marketing Strategy for Ecommerce: The Complete Guide

How to Set Up Klaviyo Flows: Complete Setup Guide

A/B Testing for Email: What to Test, How to Measure, When to Ship

Email Marketing KPIs: The Only Metrics That Matter for DTC

Email Revenue Attribution: What Klaviyo Gets Right and Wrong

Popup Strategy for Ecommerce: 6 Types That Actually Convert

RFM Analysis for Ecommerce: Segment Your Customers by Value

Email Segmentation for Ecommerce: The 5-Layer Model for DTC Brands

Welcome Offer Optimization: Converting Subscribers Without Deep Discounts

Email Warmup Strategy: How to Build Sender Reputation From Scratch

Email List Hygiene: How to Clean Your List Without Killing Revenue

SPF, DKIM, and DMARC: Email Authentication Explained for DTC Brands

The Complete Retention Marketing Strategy Guide (2026)

Winback Flow: How to Re-Engage Lapsed Customers Before You Lose Them

How to Audit Your Email Flows (The 125-Point Checklist)

Post-Purchase Email Flow: The Architecture That Drives Repeat Buyers

Sunset Flow: When and How to Remove Unengaged Subscribers

Cart Abandonment Flow: How to Recover Revenue Without Discounting

How to Build a Welcome Flow That Actually Converts

How to Build an Email Campaign Calendar Without Discounting

Browse Abandonment Flow: Converting Window Shoppers Into Buyers

The Abandoned Cart Email Strategy That Actually Recovers Revenue

How to Build a Welcome Flow That Actually Converts

Personalizing Push Notifications for Better Retention Outcomes

How to Craft Email Newsletters That Build Real Brand Loyalty
Top 3 Best eCommerce Content Management Systems of 2025

Email Marketing vs. Social Media: Which One Should Your Brand Focus On?

Attract More Customers: Which Videos to Use in Your Email Marketing and Why
8 eCommerce Customer Service Mistakes You NEED to Stop Making (Like, Yesterday)
Creating The Perfect E-Commerce Tech Stack

Types of Content eCommerce Brands Need in Their Marketing Mix
Ecommerce Email Mistakes: Blossom Ecom Article on How to Stop Sending Bad Emails & Start Making More Money
Boost Your Bottom Line: The Ultimate Guide to Integrating Website and Email Strategies for Your eCommerce Business

6 Powerful Ecommerce Loyalty Program Examples (and How to Build Your Own)
Loyalty-First Guide to Customer Reactivation Email Campaigns
Using Email Marketing to Supercharge Your Loyalty Program
Unpacking Brand and Conversion in E-Commerce Design
13 Scary E-Commerce Mistakes (and How to Avoid Them)
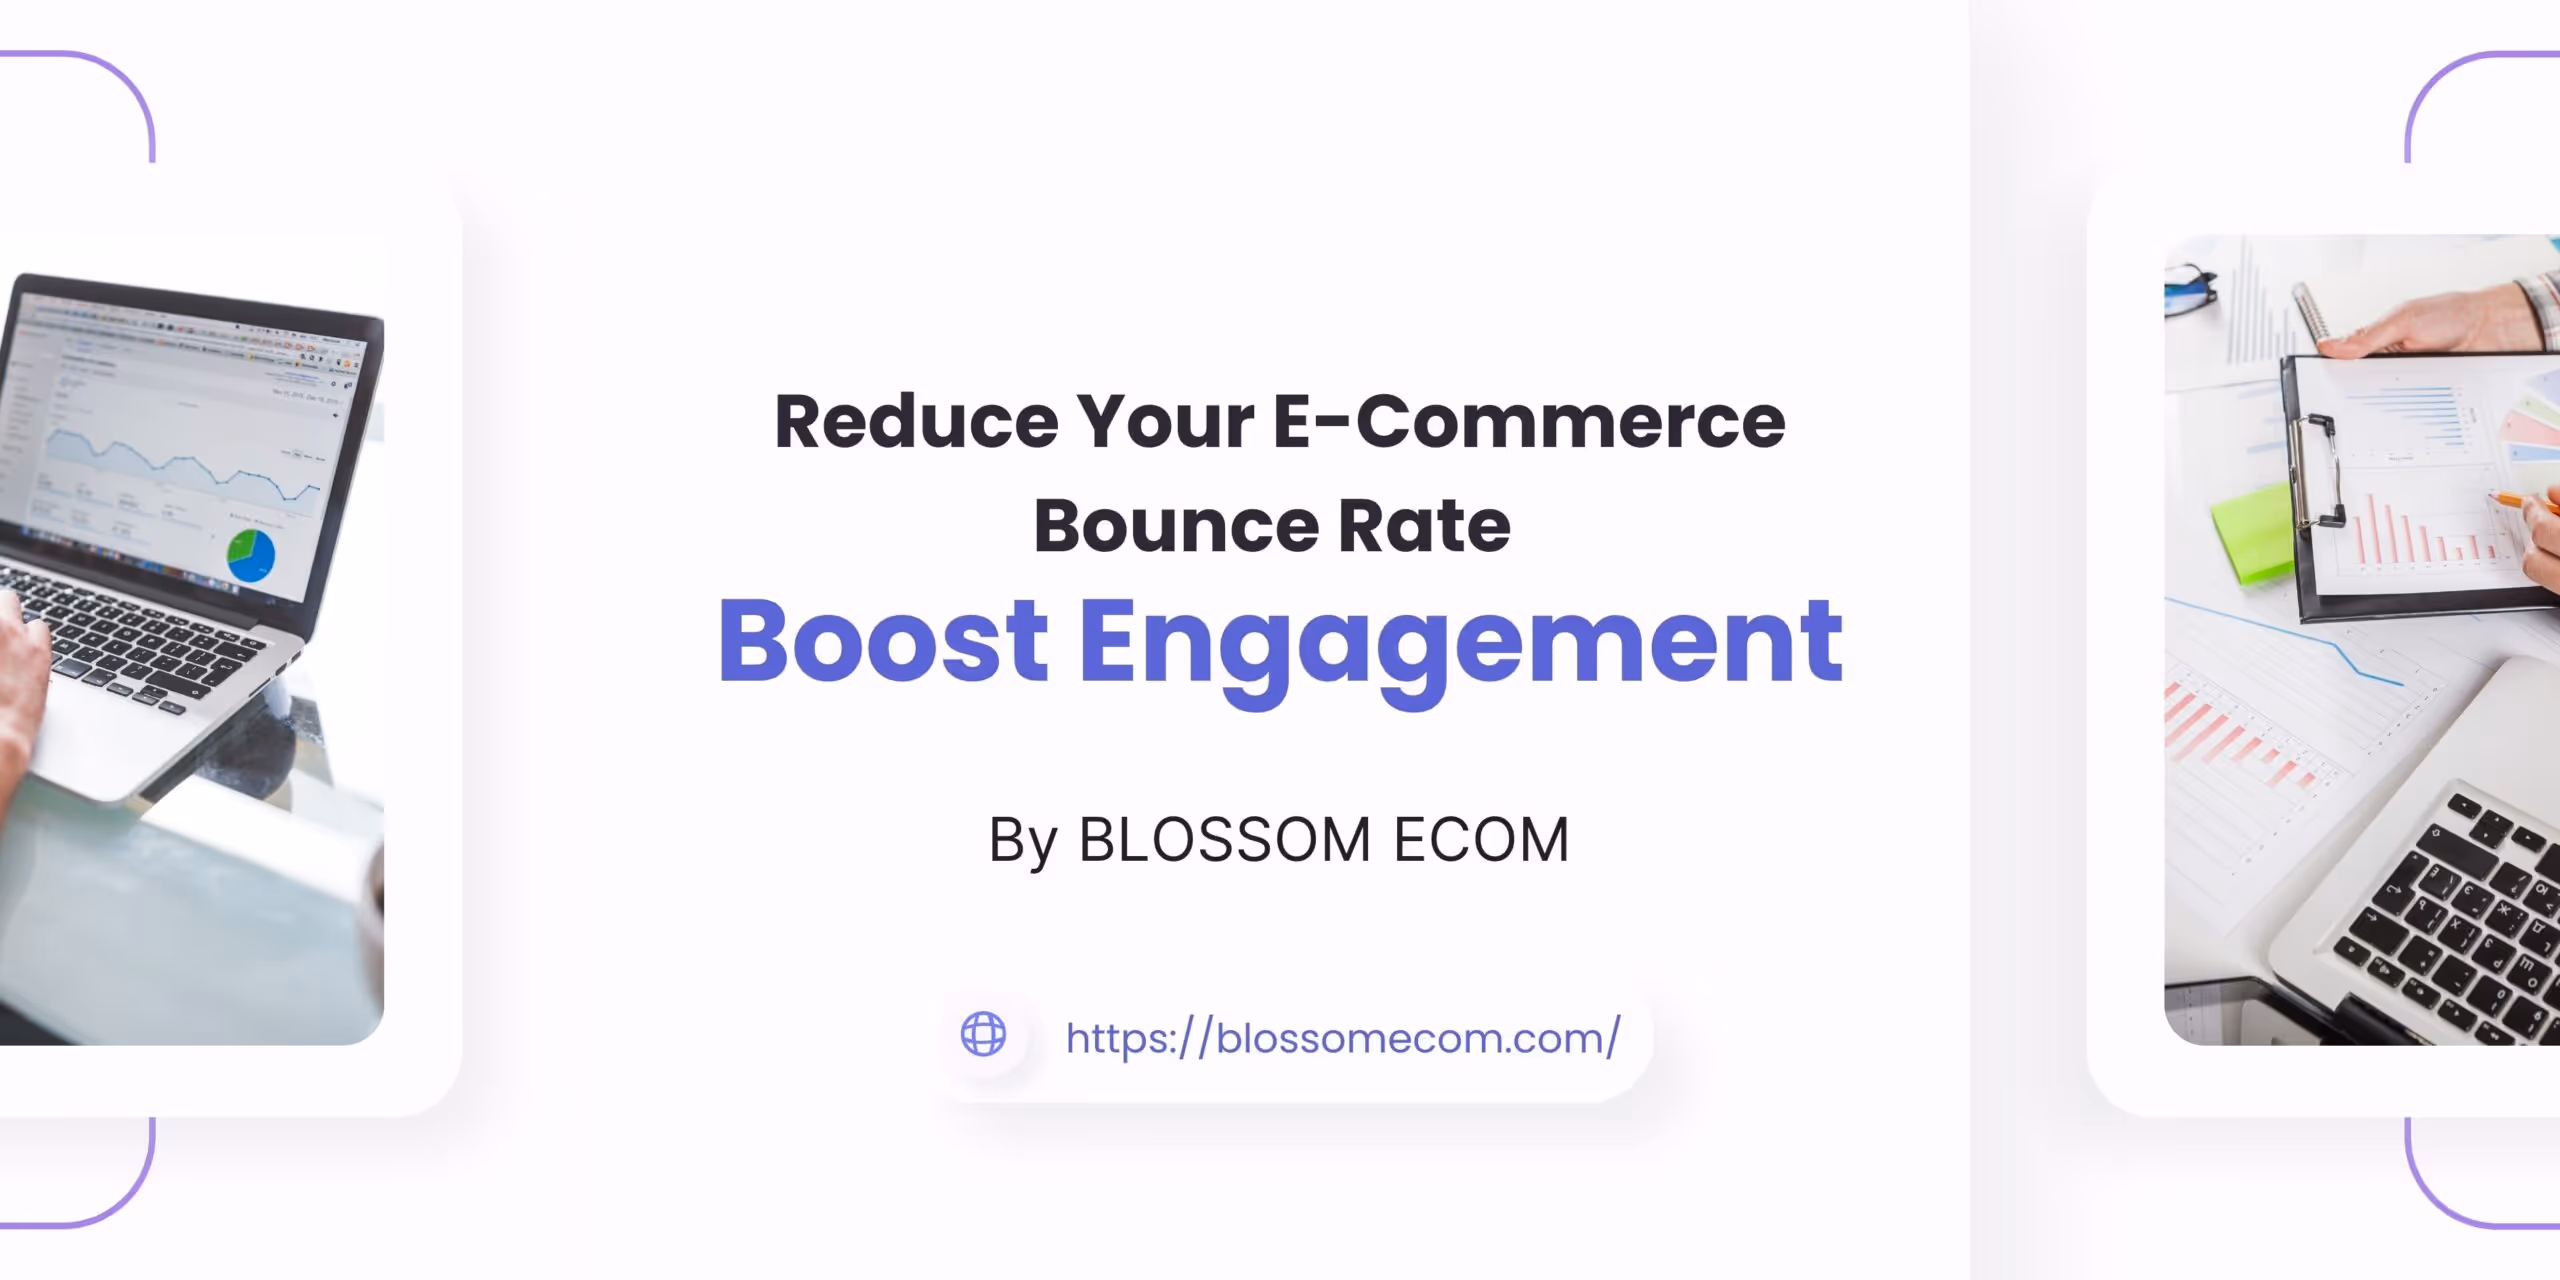
How to Reduce Your E-Commerce Bounce Rate and Boost Engagement
Combining Content and Commerce for E-Commerce Success

Email Marketing Tips + Trends

E-Commerce Returns Analysis & Crafting a Profitable Returns Policy

9 Pro Tips for A/B Testing Emails with HubSpot

AI and Email Marketing: The Future is Here
How to Skyrocket Your Email Open Rates and Click-Through Rates

Email Isn’t Dead: 4 Reasons It’s Still a Digital Marketing Powerhouse

Email Marketing Series – #3: Building a Strong Email List
Email Marketing Series – #4: 9 Tips for Creating High-Impact Email CTAs

Email Marketing Series – #2: How to Craft Attention-Grabbing Subject Lines

Email Marketing vs. Social Media Marketing — Which Should I Use?
Email Marketing Series – #1: Crafting an Effective Email Marketing Strategy
Email Open Rate: A Practical Guide

3 Effective Strategies to Make Email Your Marketing Heavyweight Champion

How to Attract New Leads with Video in Your Email Marketing
Multi-Channel eCommerce: The Key to Growing Your Online Business
Understanding eCommerce Conversion Rate & Optimization
How to Optimize Your eCommerce Website for More Conversions
Top 3 eCommerce and Digital Marketing Trends for 2025

Optimizing Your Email Marketing Strategy: A/B Testing Explained
35 Eye-Opening Email Marketing Stats You Need to Know
7 Email Marketing Tips to Boost Your SEO

11 Common Email Marketing Mistakes That Are Tanking Your Conversions (And How to Fix Them)
Strategic SEO Tips for Email Marketing: Boost Engagement and ROI
How to Measure and Increase Email Marketing ROI (Plus Templates That Convert!)

Do Lifecycle Email Campaigns Really Drive Conversions? Here’s What We Found
How to Use Remailing in Your Email Marketing Strategy

B2B Email Marketing: Building Relationships and Converting Leads
Core Email Marketing Flows: 2025 Essentials for Shopify

Top 5 Revenue-Generating Email Marketing Journeys (Straight from a Klaviyo Partner Agency)

The Long and the Short of It: Getting to “Yes” with Email Marketing
10 Email Marketing KPIs Every Marketer Needs to Know
3 Steps to Spring Clean Your Email Marketing Platform

How to Use Artificial Intelligence (AI) in Email Marketing in 2024

How To Create Marketing Emails That Engage Your Audience and Get Results

Why SMS is the Perfect Addition to Any Marketing Mix
Why Personalization is Critical for eCommerce Growth

How to Grow Your Startup’s Email List: Lessons from Daycation

How We Achieved a 27% Winback Rate with a Smart Email Strategy for Dumpling

The Hidden Pitfalls of Email Marketing: Blacklists and Spam Traps
The iOS18 Mail Update: What Marketers Need to Know

Supercharging Customer Journey Automations with Email Touchpoints
Why Your Abandoned Cart Series Needs More Than One Email
13 Simple Design Hacks Using Klaviyo Email Marketing & Shopify

5 Simple Tactics to Grow Your Klaviyo SMS List Without Overcomplicating Things


Not Sure Where to Start?
Let's find the biggest retention opportunities in your business. Get a free Klaviyo audit or retention consultation.